Wave Paint is a powerful digital timing diagram editor that works directly in your browser. Unlike text-based tools like WaveDrom, WavePaint offers an intuitive graphical user interface (GUI) that lets you draw waveforms visually, without writing JSON code.
Whether you need to create digital signal diagrams for technical documentation, digital electronics tutorials, or communication protocol specifications, WavePaint is the perfect tool for hardware designers, engineers, and students.
How to Add Signals to Your Diagram
Adding signals to your timing diagram is very simple. WavePaint offers several methods to add new signals:
Method 1: Signal Menu
- Go to the Signal menu in the top bar
- Select Add Bit Signal for single-bit signals (binary logic)
- Or select Add Vector Signal for multi-bit data buses
- The new signal will appear in the signal panel
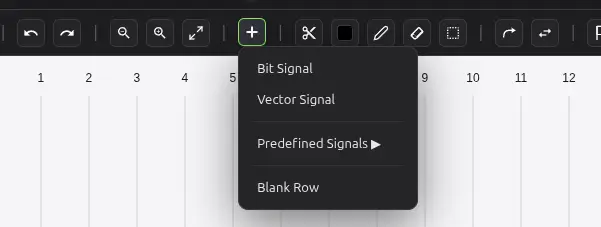
Method 2: Right-Click (Context Menu)
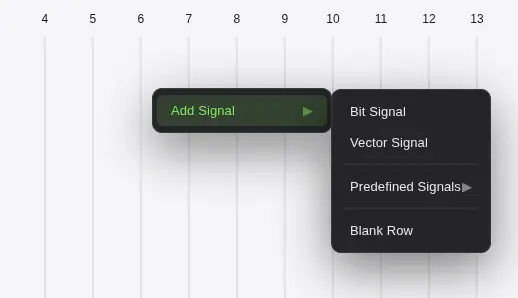
- Right-click on the signal panel area
- Select «Add Bit Signal» or «Add Vector Signal»
- Rename the signal by double-clicking on its name
ℹ️ Note: You can reorder signals by dragging them up or down in the signal panel.
Signal Types in WavePaint
WavePaint supports several digital signal types to represent different electronic design scenarios:
1. Bit Signal (Binary Signal)
Bit signals represent single-bit digital lines. They can have the following states:
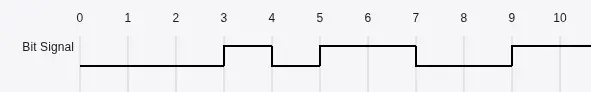
- High (1): High logic level
- Low (0): Low logic level
Ideal for: CLK, RESET, ENABLE, individual control signals.
💡 Pro Tip: Short-cut for paint letter «D»
2. Vector Signal (Bus Signal)
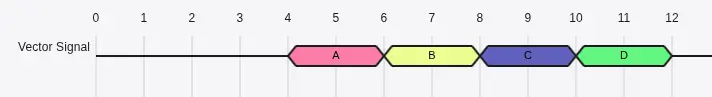
Vector signals represent multi-bit data buses. Main features:
- Shows numeric values within each segment
- Supports different formats: Hexadecimal, Decimal, and Binary
- Allows custom labels for each state
- Bus-style visualization with diagonal transitions
Ideal for: DATA[7:0], ADDRESS[15:0], communication buses.
How to Draw Waveforms
The main feature of WavePaint is its intuitive drawing system. Unlike WaveDrom where you write code, here you draw waveforms directly.
Drawing on Bit Signals
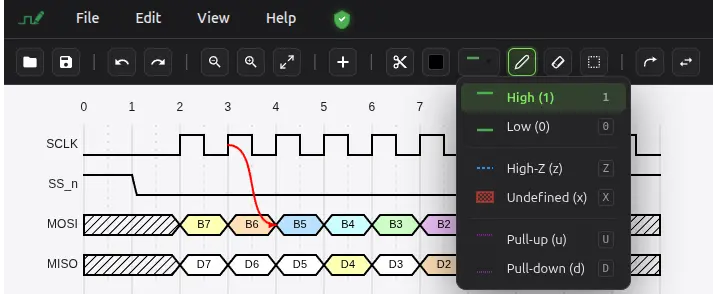
- Select the signal by clicking on its name
- Click on the drawing area at the desired time
- Select the state:
- Click upper area → High (1)
- Click lower area → Low (0)
- Context menu → Z or X
- Drag to paint multiple samples with the same value
Drawing on Vector Signals

- Click on the vector segment you want to edit
- Type the value or desired label
- Change the radix (number base) from signal properties
- Extend segments by dragging the edges
💡 Pro Tip: Hold Shift while dragging to draw large data lines.
Customization: Colors and Styles
WavePaint offers extensive visual customization options to create professional and visually attractive diagrams.
Signal Colors
- Line color: Change the stroke color of each signal
- Fill color: For vectors, you can fill the segments
- Per-segment colors: Assign different colors to specific states
Transition Styles
Configure how state changes are visualized:
- Rise Time / Fall Time: Rise and fall time (smooth transitions)
- Edge arrows: Visual indicators on clock transitions
- Hatched pattern: For special or indeterminate states
Available Themes
WavePaint includes several predefined themes:
- Dark: Ideal for extended work sessions
- Light: For printed documents
- Custom: Create your own color palette
Markers, Arrows, and Annotations
Enrich your diagrams with documentation elements to explain temporal relationships and behaviors.
Time Markers
- Add vertical lines to mark important moments
- Customize the color of each marker
- Ideal for indicating setup/hold time events
Dependency Arrows
Draw arrows between signals to show cause-effect relationships:
- Connect a clock edge with data response
- Show propagation delays
- Indicate dependencies between signals
Time Span Markers
Measure and display time intervals between two points in the diagram:
- Setup time and Hold time
- Propagation delays
- Clock periods
Text Annotations
Add free text at any position in the diagram for additional explanations, notes, or phase labels.
Signal Groups
Organize your complex diagrams by grouping related signals:
Creating a Group
- Select multiple signals (Ctrl+click)
- Right-click → «Group Signals»
- Assign a descriptive name to the group
Group Features
- Visual bracket: Groups display a side bracket that groups the signals
- Collapse/Expand: Temporarily hide signals for clean diagrams
- Nested groups: Create hierarchies of groups (subgroups)
- Customizable color: Each group can have its own bracket color
ℹ️ Ideal for: Interfaces like AXI, APB, Ethernet where there are multiple related signals that benefit from being visually grouped.
Import and Export Diagrams
Supported File Formats
Import:
- WavePaint (.wp): Native format with all features
- WaveDrom JSON: Import existing WaveDrom diagrams
- VCD (Value Change Dump): Import simulation traces from Verilog/VHDL
Export:
- PNG: High-quality raster image
- SVG: Scalable vector graphic (ideal for documents)
- JPG: Compressed image for web
- WaveDrom JSON: Compatible with the WaveDrom ecosystem
Exporting for Documentation
To include diagrams in datasheets, technical documentation, or presentations:
- Go to File → Export
- Select the desired format (recommended: SVG for quality)
- Configure export options
- Save the file
💡 Tip: Use SVG for professional documentation as it’s scalable without quality loss.
WaveDrom Compatibility
WavePaint is fully compatible with WaveDrom, the popular JavaScript library for text-based timing diagrams.
From WaveDrom to WavePaint
If you have existing diagrams in WaveDrom JSON format:
- Copy your WaveDrom JSON code
- In WavePaint: File → Import → WaveDrom JSON
- Paste the code or select the file
- The diagram will automatically convert to visual format
From WavePaint to WaveDrom
To use your diagram in environments that only support WaveDrom:
- File → Export → WaveDrom JSON
- Copy the generated code
- Use it in Markdown documentation, wikis, or presentations
Real-Time Preview
WavePaint includes an integrated WaveDrom preview that shows how your diagram will look rendered with the official WaveDrom library.
Common Diagram Examples
- SPI Protocol: SPI communication diagram showing CLK, MOSI, MISO, and CS
- AXI Bus: Read/write transactions on AMBA AXI bus
- DDR SDRAM: DDR memory access cycles with commands and data
- Ethernet MII: Media Independent Interface for Ethernet communication
WavePaint includes a gallery of predefined examples that you can load directly from File → Open Example.
Frequently Asked Questions
Is WavePaint free?
Yes, WavePaint offers a free version with all essential features to create professional timing diagrams.
Can I use WavePaint offline?
WavePaint is a web application that runs in the browser. Once loaded, you can work offline and save your files locally.
Is it compatible with VCD files from simulators?
Yes, WavePaint can import VCD (Value Change Dump) files generated by simulators like ModelSim, Vivado, GHDL, Icarus Verilog, and others.
What’s the difference between WavePaint and WaveDrom?
WaveDrom is a text-based library where you describe diagrams with JSON code. WavePaint is a visual editor (GUI) that lets you draw diagrams intuitively, without writing code. Both are compatible: you can import/export between them.
Start Creating Your Diagrams Now
Don’t wait any longer to create professional timing diagrams. WavePaint is the tool you need to document your digital designs, create tutorials, or specify communication protocols.